Two American cities have finally cracked one of the hardest codes in city planning: Even with low gas prices, even with population growth, even with Uber and Lyft circling 24/7, Minneapolis and Seattle have reduced the amount of driving in their cities.
Vehicle miles traveled are down 2 percent in Minneapolis between 2007 and 2016, according to city officials. During that time the city gained roughly 30,000 residents.
Average daily traffic declined 5 percent in Seattle over roughly the same period — between 2006 and 2017, according to Dongho Chang, the city's lead traffic engineer.
Believe it or not, this is a rare feat. For example, San Francisco's vehicle miles traveled increase 13 percent between 2010 and 2016, according to city records [PDF].
So how did Minneapolis and Seattle do it? They're doing a lot of things right. Here's a short rundown:
Minneapolis
In the last decade, Minneapolis has made some important investments in public transit. The city opened its popular Green Line light rail in 2014 and it now carries 37,000 riders a day. The region has also been building a network of bus rapid transit service, beginning in St. Paul.
The city is also famously bike friendly and has been steadily adding bike infrastructure. In 2016, bike commuting rates reached an all-time high of 5 percent.
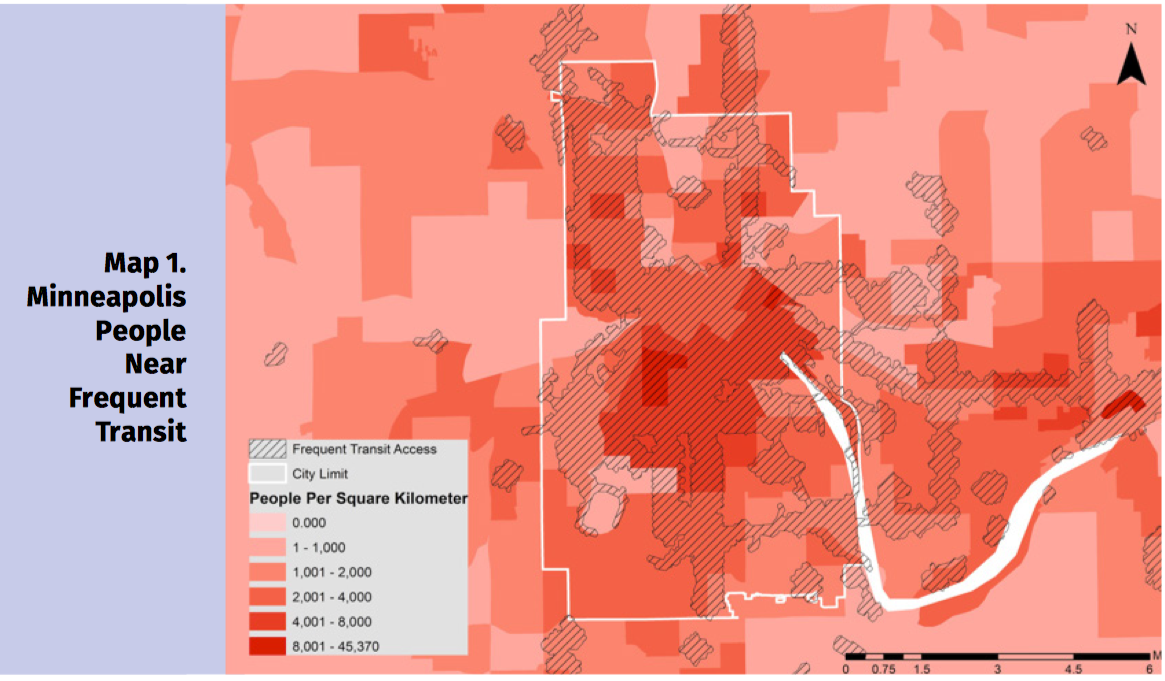
A recent report from the Institute for Transportation and Development Policy singled out Minneapolis (and also Seattle) as one of the standouts among 25 biggest American cities examined for non-car commuting. In Minneapolis, about a quarter of residents walk, bike or take transit to work; 73 percent of the population lives near frequent transit. Minneapolis was helped along, ITDP writes, by its strong bike infrastructure:
The population near frequent transit is 9 percent higher, rising from 64 to 71 percent, when bike infrastructure is included in the analysis. The 9 percent increase from bike infrastructure means that 35,700 more people can reach frequent transit stops in 10 minutes or less on physically protected bike lanes.
Bill Lindeke, a local urbanist writer, says he thinks it's really walkable development that has helped Minneapolis put a lid on driving miles.
Between 2010 and 2016, the area saw a surge in urban infill development. In 2016 alone, for example, there were 8,202 apartments and townhomes built in the metro region, dwarfing construction of single family homes. The average new resident in the Twin Cities region between 2010 and 2016 occupied about a third of the land as those from the previous decade, the Pioneer Press reports.
"There’s been a lot of development of former parking ramps and a lot of surface lots," said Lindeke, especially in downtown and South Minneapolis. "Grocery stores are being built within walkable areas where we live."
Legislation, recently passed by City Council allowing triplexes in every neighborhood and eliminating all minimum parking requirements from the city's zoning code will no doubt further the city's densification. Minneapolis' climate goal is to reduce total miles driven in the city by 40 percent by 2050.
Seattle
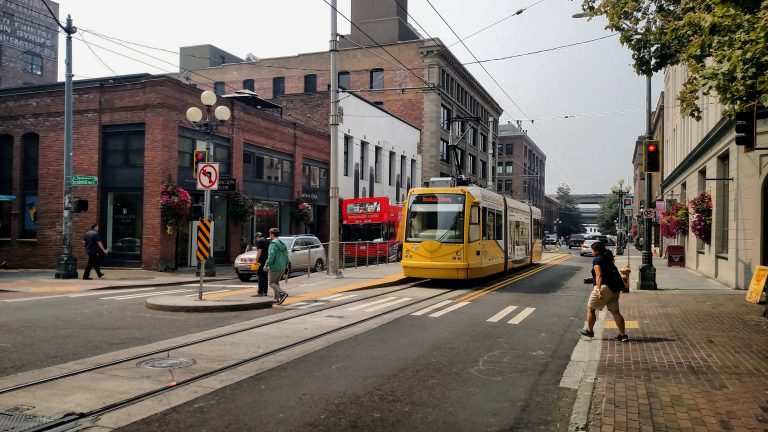
Seattle has succeed where a lot of other cities haven't through a range of strategies, probably most importantly through major investment in both bus and rail transit.
In 2016, Seattle passed its third successive light rail expansion package, which will add 62 miles of track across the metro region for the cost of $53 billion. The same year, the city completed a major light rail/subway project, University Link extension to Link Light Rail, connecting downtown to University of Washington in eight minutes (versus a 50 minute car ride). The opening of the new stations caused light rail ridership to soar 51 percent year over year across the light rail system.
But plenty of cities — Los Angeles, Denver — have added a lot of rail transit and still seen ridership slump.
What also distinguishes Seattle, to some extent, is its tandem investment in bus transit. In 2014, King County metro was facing a funding shortfall. Rather than let the transit system fall into the "transit death spiral," where service cuts lead to ridership losses which set the table for more cuts, Seattle voters dug into their pockets. They approved a city-only $60 vehicle registration fee and a 0.1-percent sales tax hike to beef up bus service, adding 270,000 service hours. Using those funds, the city was able to make huge strides in the number of households that are served by frequent transit, running every 10 minutes.
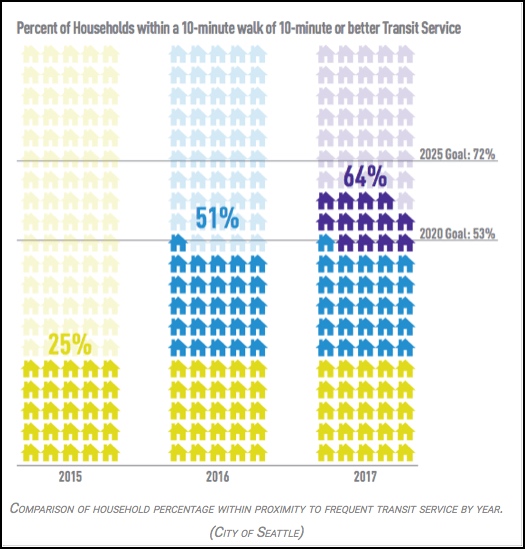
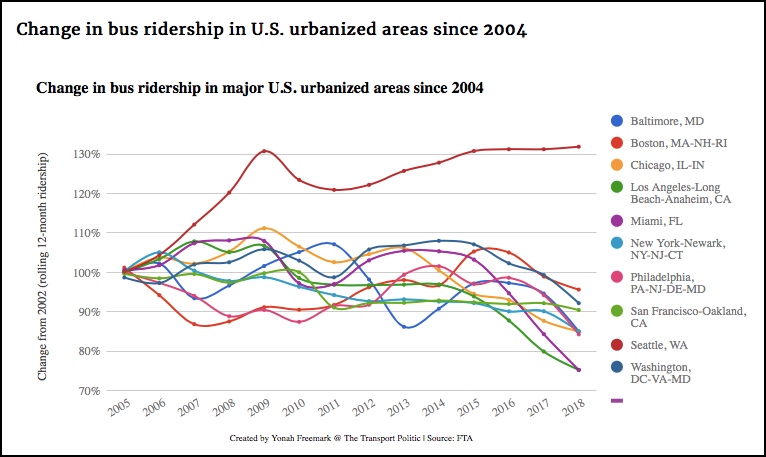
As you can see below, that helped Seattle buck a national trend in slumping bus ridership.
Meanwhile, the nonprofit organization Commute Seattle has helped discourage solo car commuting downtown — which is a small area surrounded by water with limited surface street capacity. It's worked. Only about 25 percent of Seattle's downtown workers drive alone. And the downtown area was able to add about 45,000 new jobs without increasing car traffic.
Seattle has also done a lot — but could do more — to make its streets more walkable and bike friendly. It was also named the Top Biking City in America by Bicycling Magazine in 2018.
Chang says that the city is still calculating vehicle miles traveled for 2018, and it may have increased slightly, depending on whether the calculation includes highways or just city streets.
Read More:
Stay in touch
Sign up for our free newsletter
More from Streetsblog USA
Thursday’s Headlines Don’t Like Riding on the Passenger Side
Can you take me to the store, and then the bank? I've got five dollars you can put in the tank.
Study: When Speed Limits Rise on Interstates, So Do Crash Hot Spots on Nearby Roads
Rising interstate speeds don't just make roads deadlier for people who drive on them — and local decision makers need to be prepared.
‘We Don’t Need These Highways’: Author Megan Kimble on Texas’ Ongoing Freeway Fights
...and what they have to teach other communities across America.
Should Wednesday’s Headlines 86 SUVs?
American tax law encourages people to buy the gas-guzzling and deadly vehicles, but some in Canada are pushing to ban them.

Brightline West Breaks Ground on Vegas to SoCal High-Speed Rail
Brightline West will be a 218-mile 186-mile-per-hour rail line from Vegas to Rancho Cucamonga — about 40 miles east of downtown L.A. — expected to open in 2028.