It might seem like a small thing: reducing motor vehicle speeds 10 miles per hour. But that 10 mph can make an enormous difference for the safety of a street and how comfortable people feel walking or biking there.

Bill Lindeke does a great job explaining what he calls "the critical 10" in a recent post at Streets.mn:
If you look at the average speed of traffic on urban commercial streets, there are a lot of things that begin to change when you slow down cars from the 30 to 35 mile per hour range into the 20 to 25 mile per hour range. Most importantly, perception, reaction time, and crash outcomes are far better at 20 than at 30 mph, while traffic flow doesn’t seem to change very much.
The perception angle is perhaps the most interesting. Driving speed has a dramatic effect on the driver’s “cone of vision.” You can see a lot more detail at 20: people on the sidewalk, a bicyclist in the periphery, or the ‘open’ sign on a storefront. At 30 mph, the window shrinks dramatically.
The same is true for what you might call ‘reaction time. I’ll often talk to drivers about urban bicycling, and they’ll respond with a terrified story about the time that they “almost hit” a bicyclist that “jumped out” at them. And “I didn’t see them” is a common refrain heard by any police officer investigating a crash. The problem is that once you hit 30+ speeds, it’s a lot more difficult to stop in time to make any difference on a potential crash.
These three factors are the big reasons that crash outcomes vary so dramatically on either side of “the critical ten.” It’s no exaggeration to say that lives depend on getting speeds right.
Elsewhere on the Network today: The State Smart Transportation Initiative shares new USDA findings about the relationship between transportation and access to healthy food for low-income people. And Carfree Austin says the Texas capital has work to do stitching its street network back together for better walkability.
Stay in touch
Sign up for our free newsletter
More from Streetsblog USA
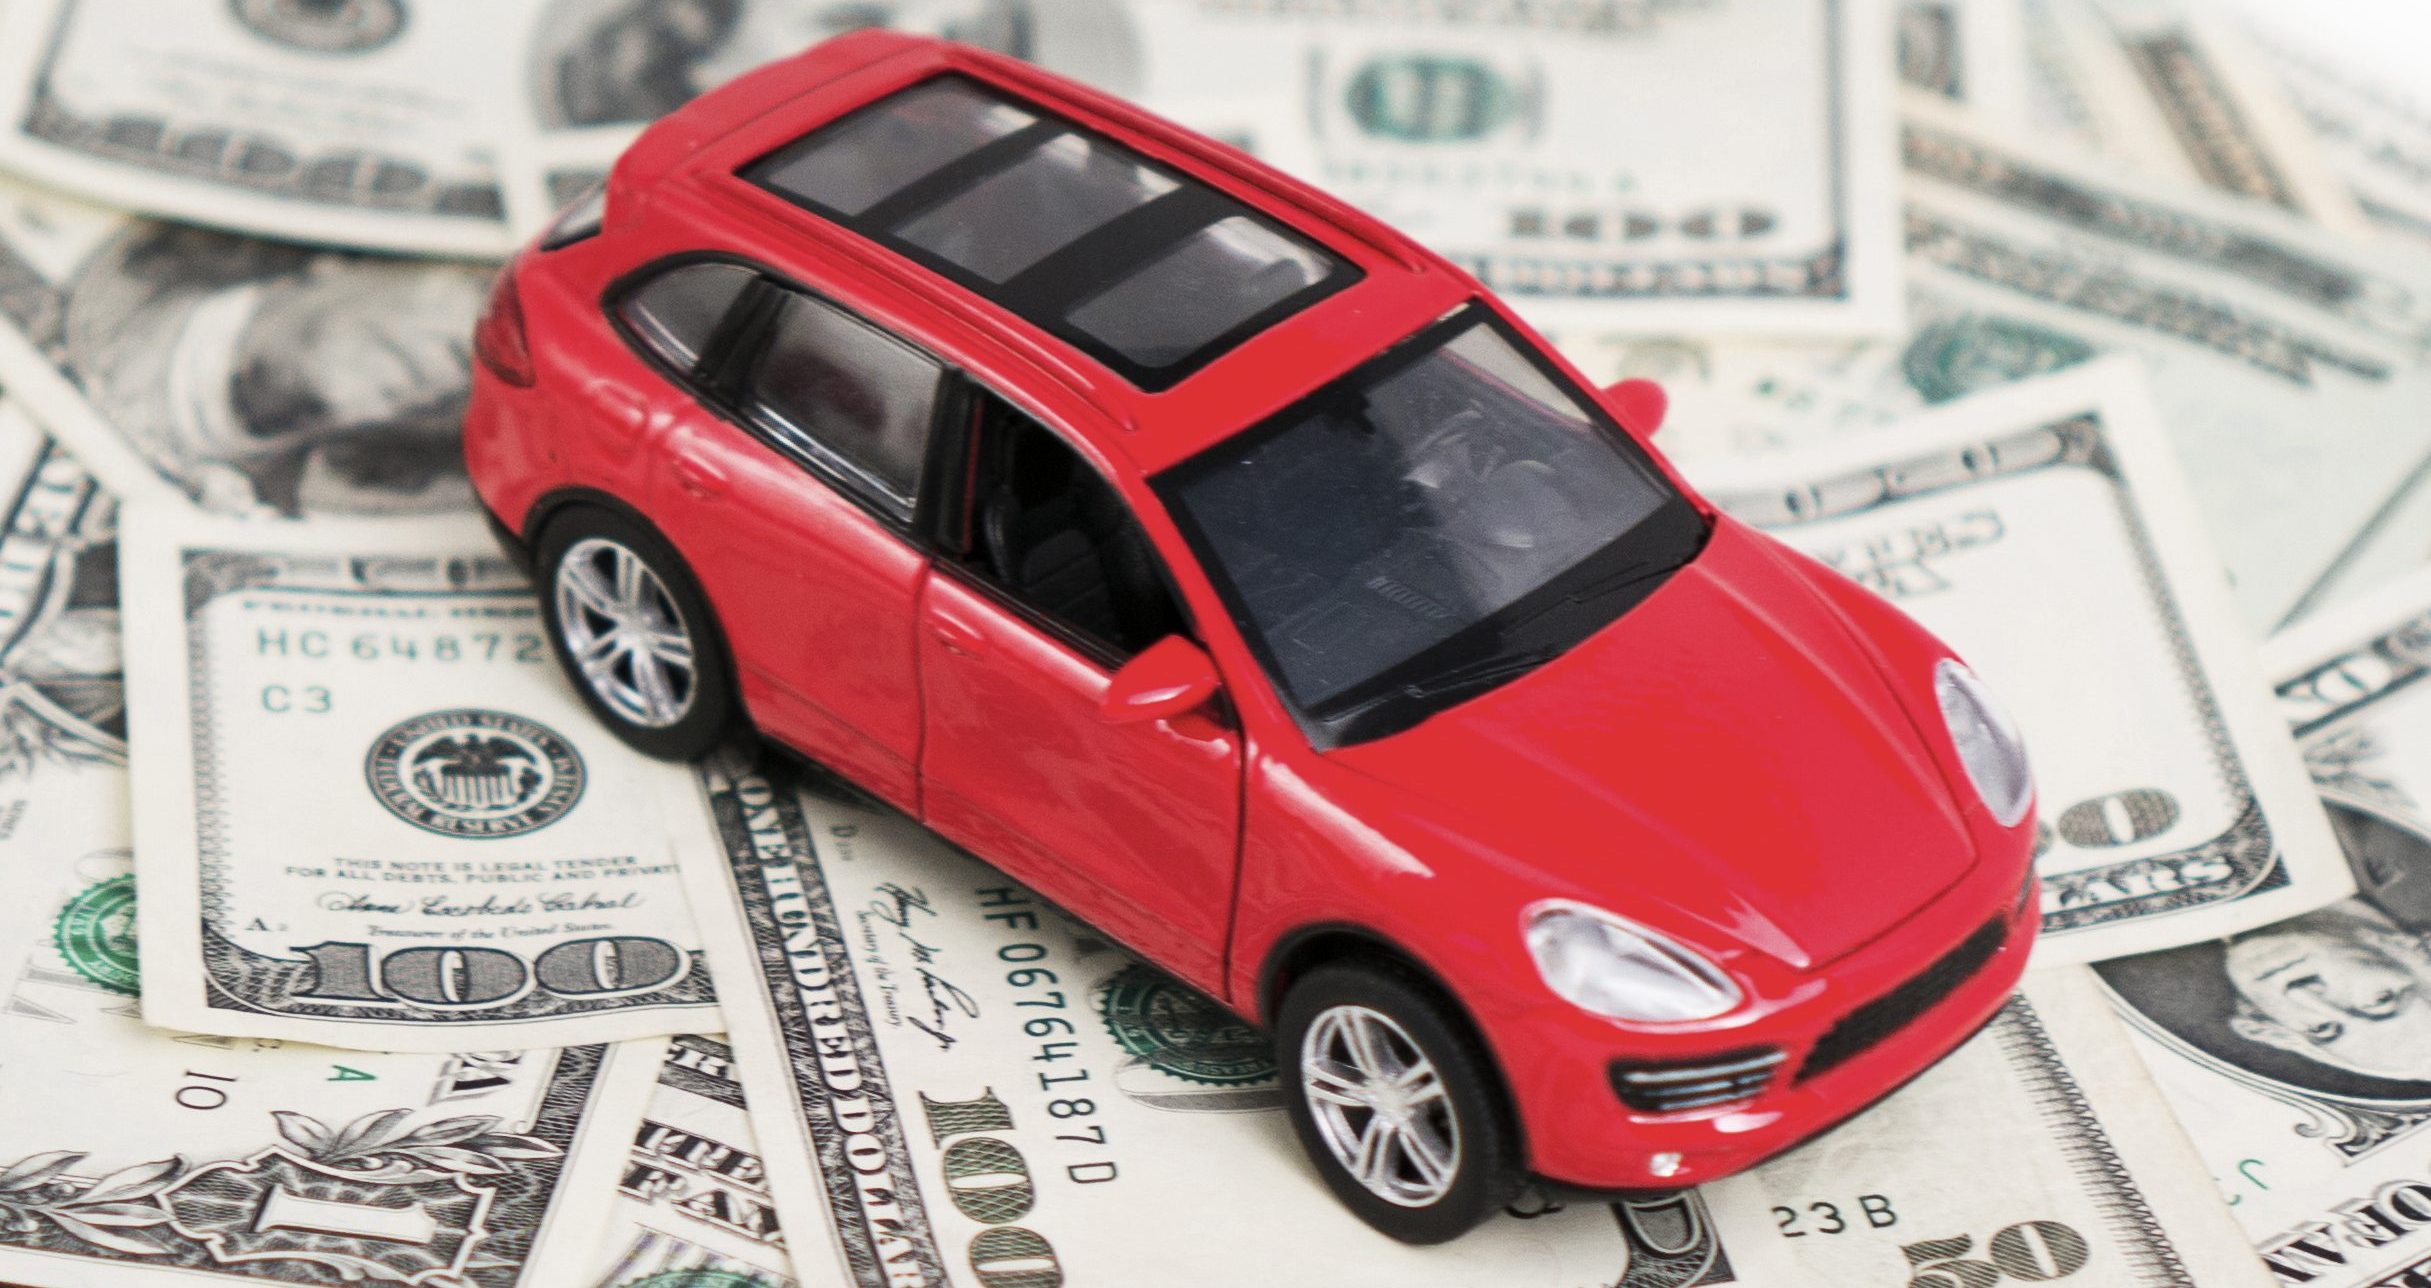
Tuesday’s Headlines Are Driving Inflation
Driving — specifically, the cost of car ownership — is one of the main factors behind inflation, according to the Eno Center for Transportation.
SEE IT: How Much (Or How Little) Driving is Going on in America’s Top Metros
Check it out: The lowest-mileage region isn't the one you'd think.
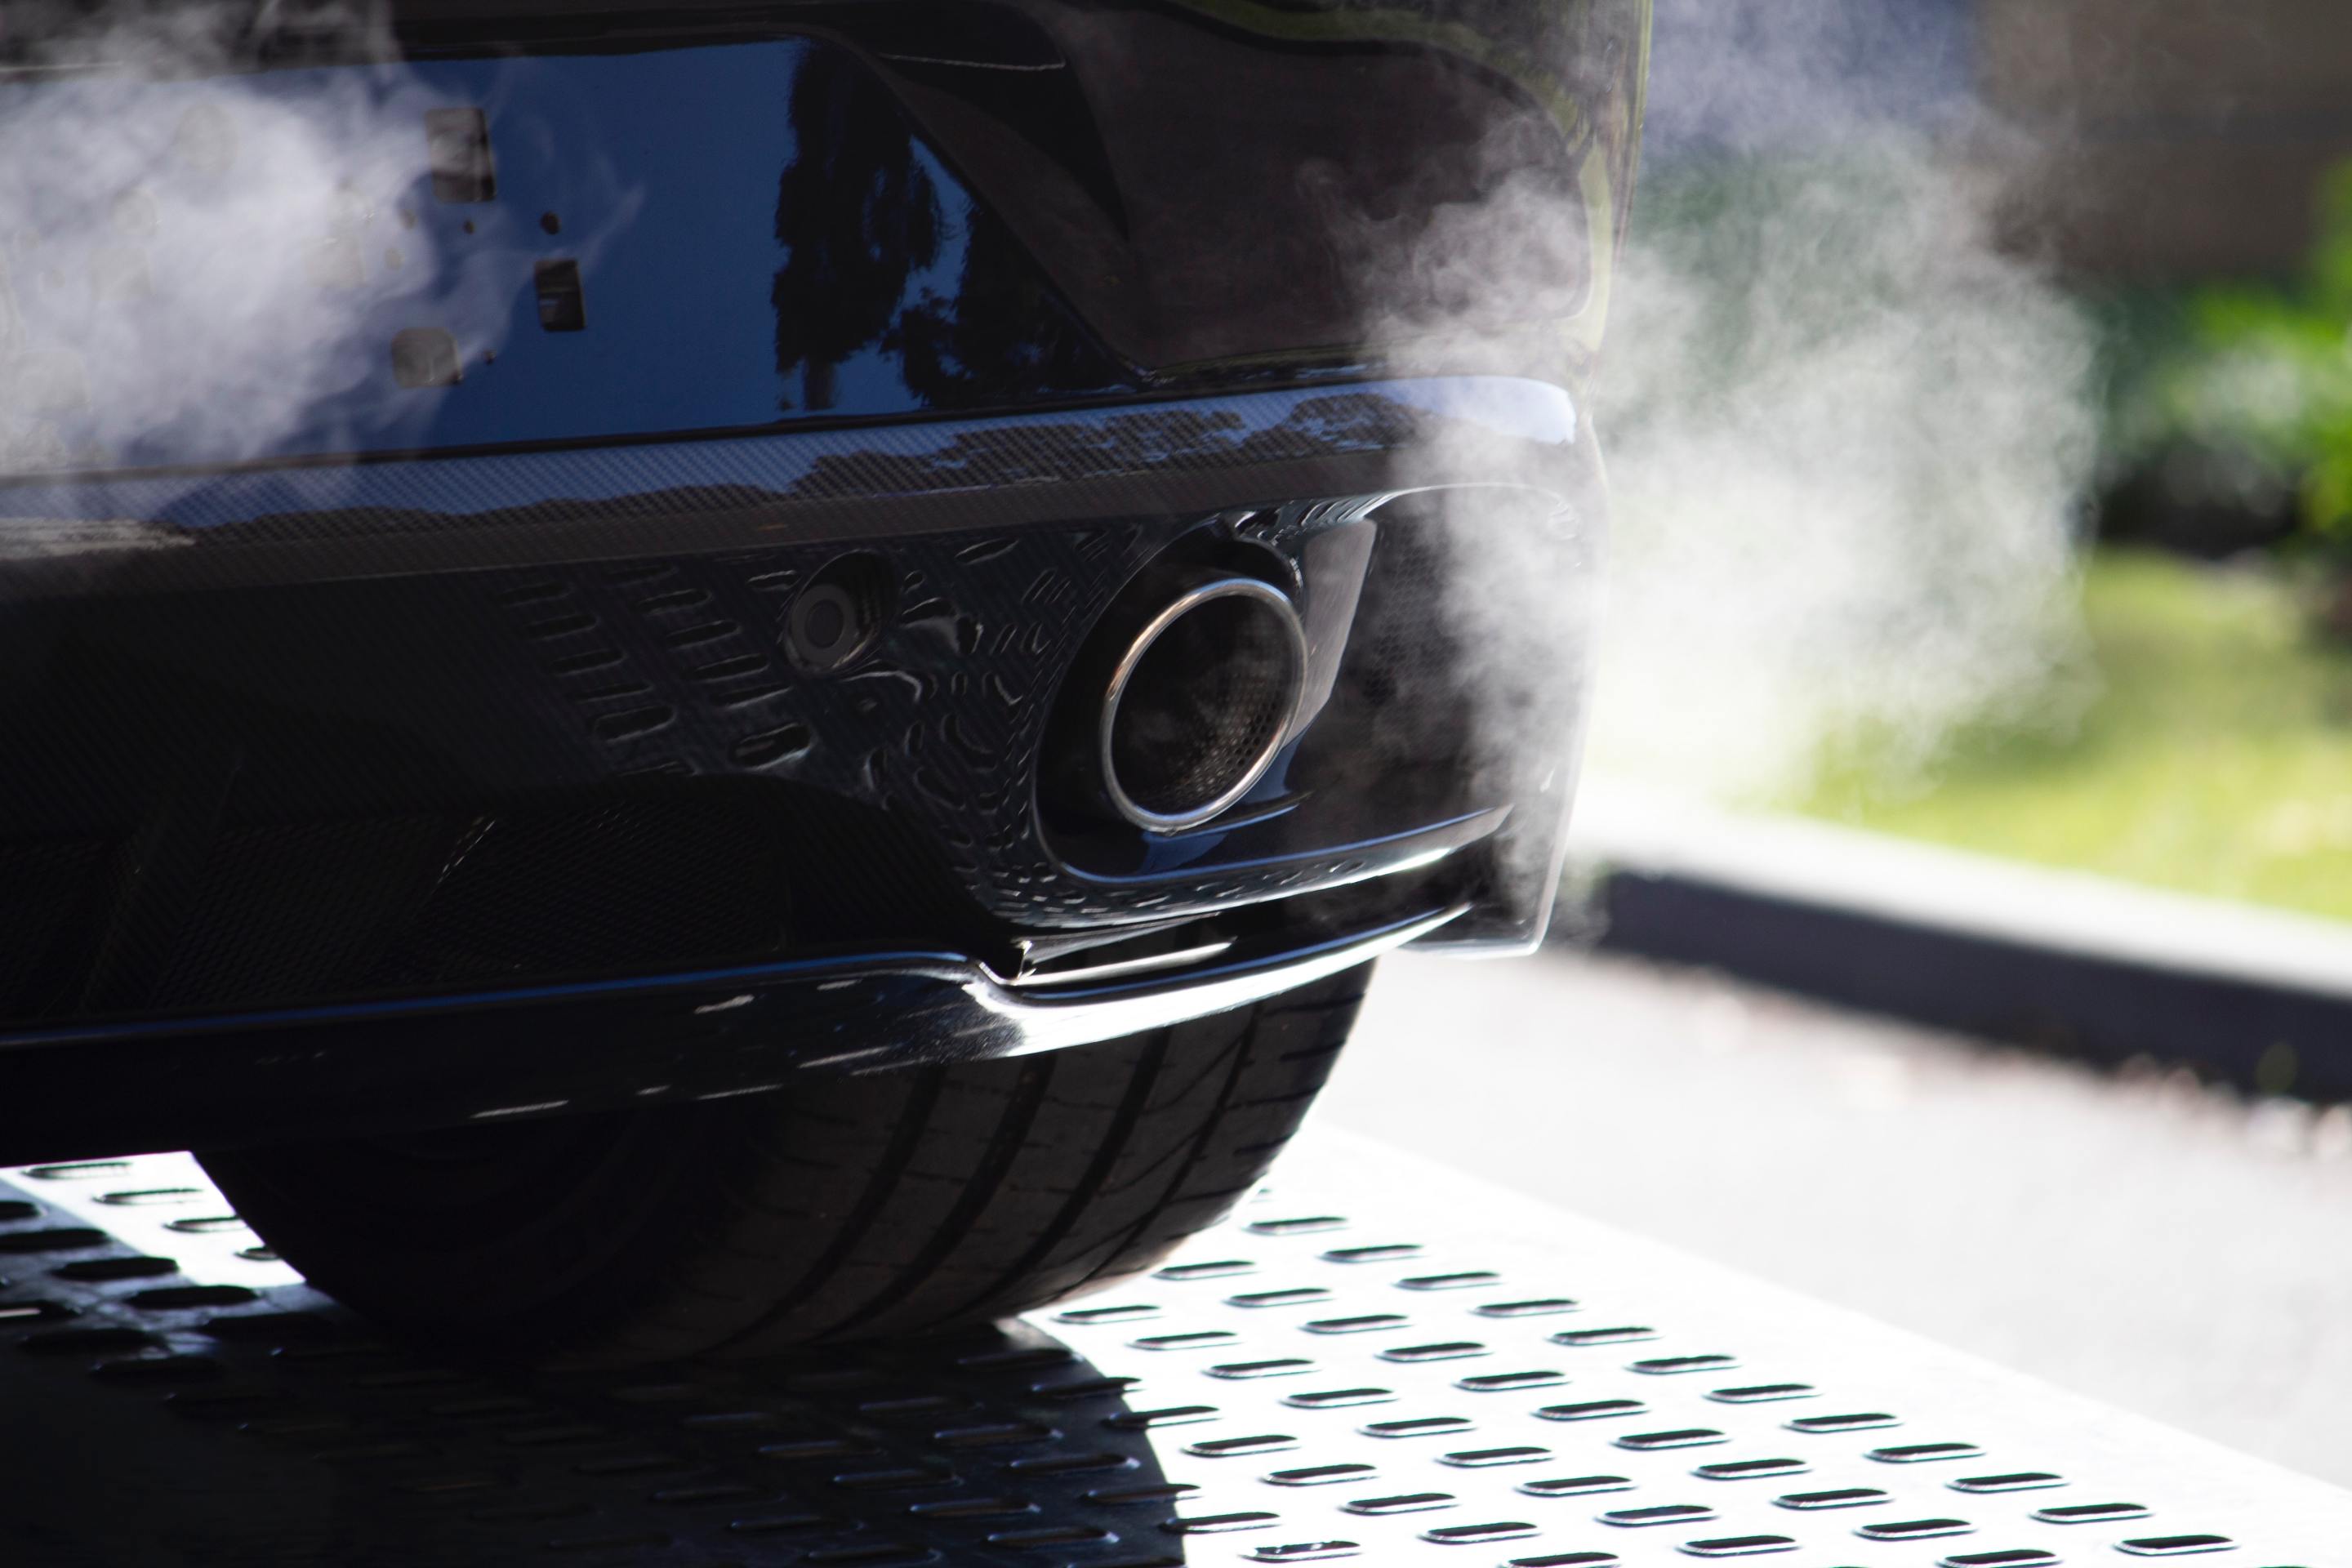
Monday’s Headlines Bring Another Setback
The Biden administration's new rule requiring states to report their greenhouse gas emissions from transportation was dealt another blow when the Senate voted to repeal it.
‘The Bike Is the Cure’: Meet New Congressional Bike Caucus Chair Mike Thompson
Meet the incoming co-chair of the congressional bike caucus — and learn more about how he's getting other legislators riding.
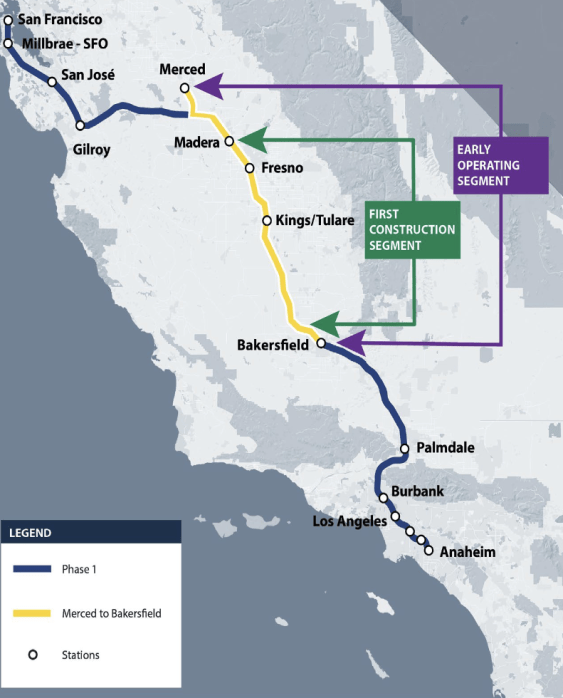
Calif. High-Speed Rail Takes a Step Towards Acquiring Trains
The contract calls for two prototype trainsets for testing to be delivered by 2028, and four trainsets to be used on the "early operating segment" between Merced and Bakersfield, ready between 2030 and 2033.