Comparing 20 Years of Housing Growth in American Cities
Here's an interesting way to visualize how different regions are growing (or not). Using a tool developed by the University of Virginia Demographics Research Group, Michael Andersen at Bike Portland shares these charts showing where housing growth has happened relative to city centers. The dark brown lines show the number of occupied housing units at one-mile intervals from the urban core in 2012, and the orange lines show the distribution in 1990. The gap between the lines tells you where housing growth has happened, and there is huge variation between regions.
In Denver, for instance, you can see that housing growth was concentrated between eight and 20 miles from the city center:

In other places -- especially large, in-demand coastal cities like LA -- housing growth has barely changed (note that the y-axis is scaled differently in each chart):

And some rust belt metros, like Pittsburgh, have actually seen a decline in center city housing occupancy:

Andersen says Portland's pattern is unusual:

Notice how housing growth tapers and then stays very low at about 15 miles out? That's Portland's urban growth boundary. Andersen thinks it's helped the city's development patterns evolve in a healthy way, but going forward he wonders if the city center will keep up with the times:
The more you look at, the more Portland’s chart up at the top stands out. Our urban growth boundary (including the fuzzier but still functional one in Clark County, Washington) hasn’t stifled growth; it’s directed it, mostly to the inner suburbs.
But things have been changing. For the fourth year in a row, the Census Bureau reported Thursday, Multnomah County added more residents than any of its suburbs.
Over 20 years, the Portland area has mostly kept up with wave after wave of demand for suburban homes. Will its central city be able to do the same?
Elsewhere on the Network today: ATL Urbanist discusses the link between poverty and car dependency in the capital of the South. And after visiting a monument to Sam Walton in Oklahoma, Strong Towns' Chuck Marohn reflects on how future generations will view the Wal-Mart founder's impact on America's transportation system and build environment.
Stay in touch
Sign up for our free newsletter
More from Streetsblog USA
Friday’s Headlines Got Served
Another day, another GOP lawsuit trying to overturn a Biden administration climate change rule.

Disabled People Are Dying in America’s Crosswalks — But We’re Not Counting Them
The data on traffic fatalities and injuries doesn’t account for their needs or even count them. Better data would enable better solutions.

LA: Automated Enforcement Coming Soon to a Bus Lane Near You
Metro is already installing on-bus cameras. Soon comes testing, outreach, then warning tickets. Wilshire/5th/6th and La Brea will be the first bus routes in the bus lane enforcement program.

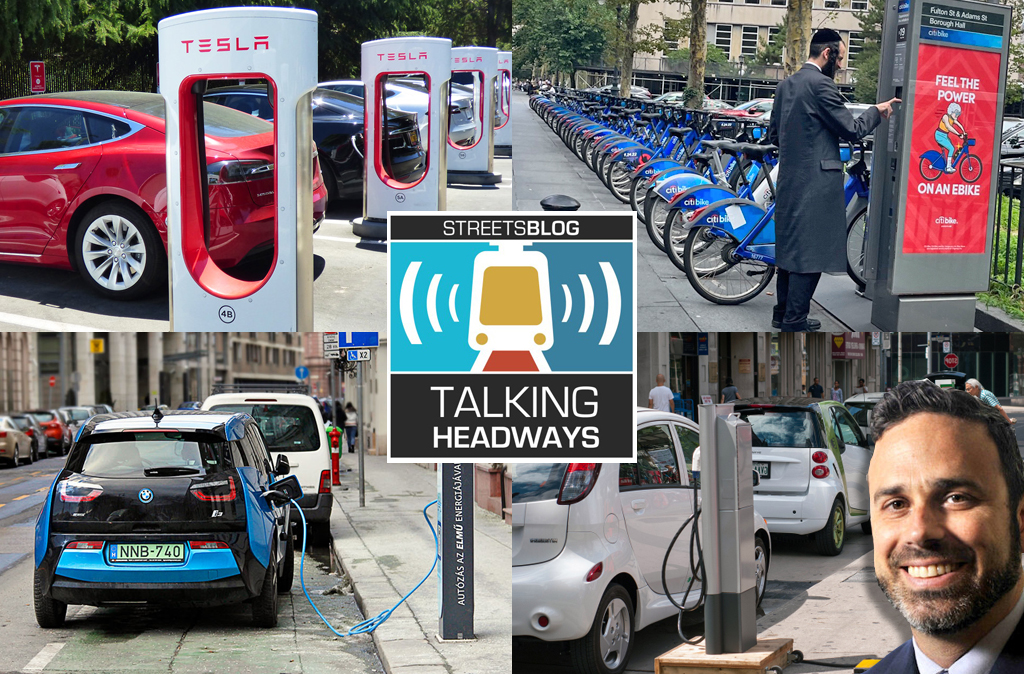
Talking Headways Podcast: Charging Up Transportation
This week, we talk to the great Gabe Klein, executive director of President Biden's Joint Office of Energy and Transportation (and a former Streetsblog board member), about curbside electrification.
Why Does the Vision Zero Movement Stop At the Edge of the Road?
U.S. car crash deaths are nearly 10 percent higher if you count collisions that happen just outside the right of way. So why don't off-road deaths get more air time among advocates?