Why Is It Still So Hard to Find Out How States Are Spending Transpo Money?
You would be lucky to get half as much information about a $5 million transportation project in your state as you can get from a toothpaste tube about how to brush.
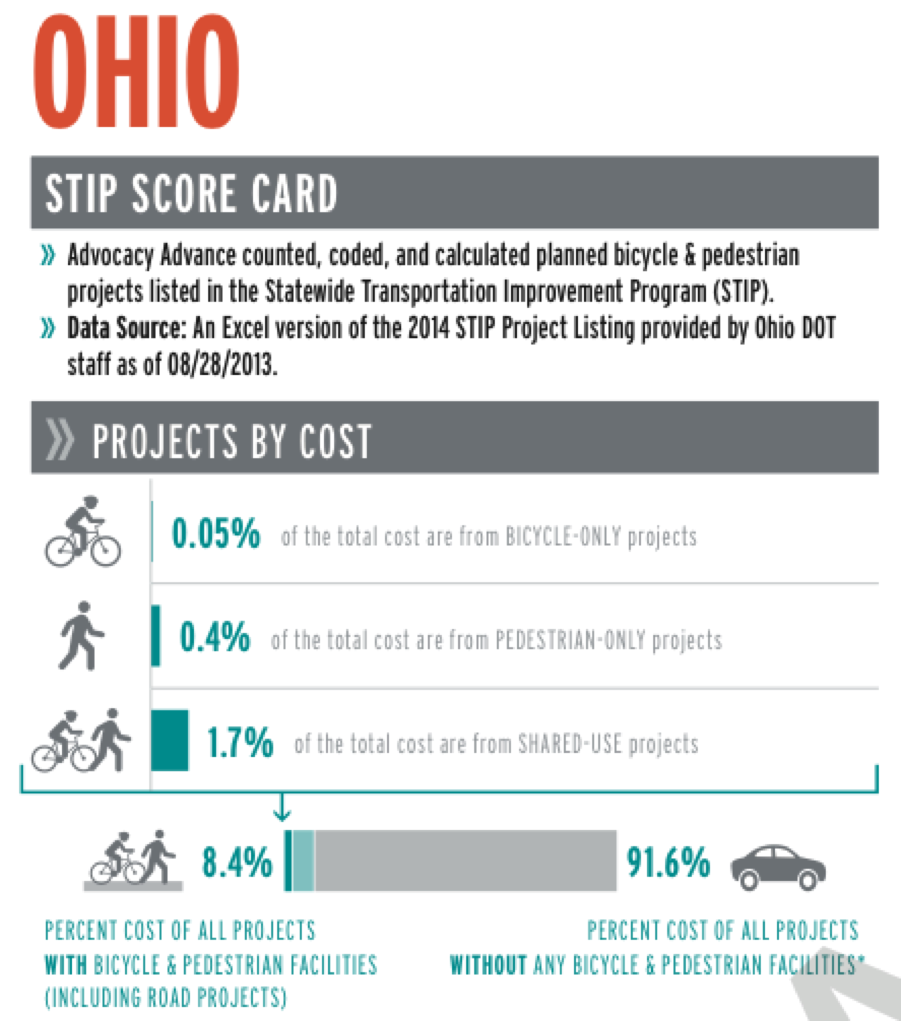
That sad comparison comes from a new report by Advocacy Advance (a project of the League of American Bicyclists and the Alliance for Biking and Walking). The report -- “Lifting the Veil on Bicycle & Pedestrian Spending: An Analysis of Problems & Priorities in Transportation Planning and What to Do About It” [PDF] -- compares bike/ped spending in State Transportation Improvement Programs, the spending plans state DOTs have to publish at least once every four years.
While toothpaste directions average six sentences, the average state DOT project description is just one sentence.
And when trying to decipher how your state is spending millions of dollars on a given transportation project, you shouldn’t be surprised to come across something like this: “SH 28, SALMON SB, SHARED USE PATHWAYS, PHS I." That’s all Idaho tells the public about how its transportation dollars are being spent.
"Generally, state advocates know about the STIP but they don’t see it as a useful place to put their time because there are so many issues with it," said Ken McLeod, the author of the Advocacy Advance report. "It’s hard to produce data from it that's actionable for them or their constituents. So there's some frustration at the state and local level, knowing that there's this document with great potential that's unrealized."
McLeod dug deep to determine what projects involved bike/ped spending. He separated out bike-only, ped-only, and bike-and-ped projects, and then separately categorized larger road projects with a bike/ped element. And he looked beyond DOTs' “bike/ped” coding to determine for himself when a project invested in infrastructure for walking and biking.
Advocacy Advance used the data to produce scorecards for each of the 50 states. (Since the District of Columbia isn't a state and so doesn't have to produce a STIP, it was left out of the analysis.)
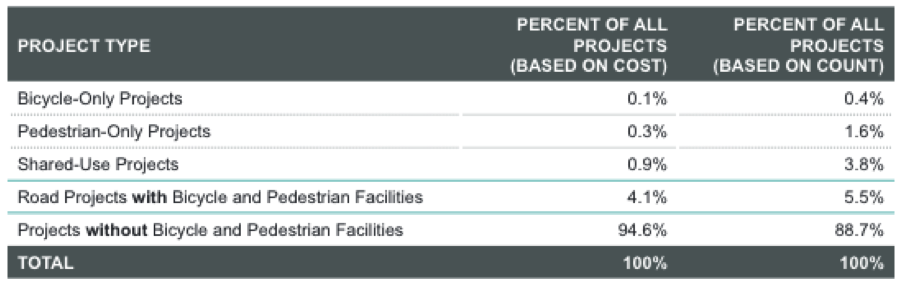
The share of projects that include identifiable bicycle and pedestrian facilities ranged from 1.3 percent in Oklahoma to 27.1 percent in Washington state. When you look at costs, it breaks down like this: Oklahoma spent 98.3 percent of its transportation dollars on projects with absolutely nothing for people outside of cars. Washington spent 79.9 percent of its money that way.
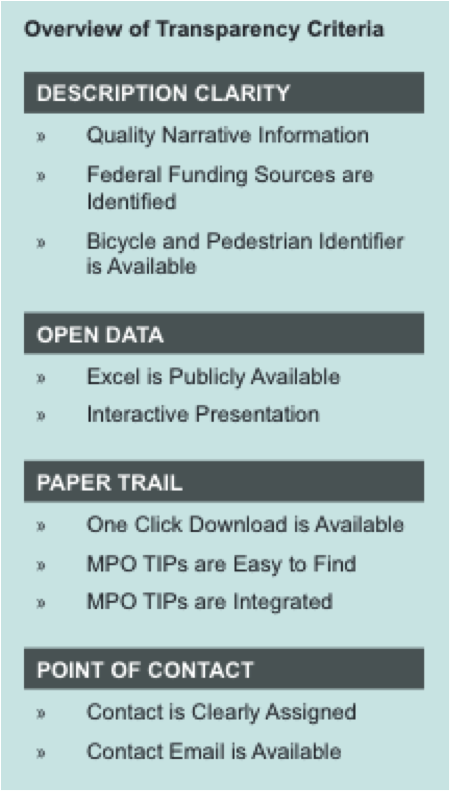
The report goes beyond determining how much states are spending on bike/ped facilities and provides a detailed analysis of how DOTs present STIPs to the public -- and what could make these documents more transparent.
STIPs may include locally funded projects, so they may not add up to an accurate picture of how states spend the $37.7 billion in federal transportation funds they receive every year. Plus, as Smart Growth America reported in 2012, states can promise one thing in their STIPs and then do quite another in practice. So even the best STIP may not faithfully reflect how money is actually spent.
Working within those limitations, Advocacy Advance found that nationwide, states are planning to spend 1.3 percent of federal transportation dollars on projects that create only bicycling and walking facilities in 2014. Add in larger road projects with a bike/ped element and the average jumps to 5.4 percent -- but that figure is inflated because you can’t separate the specific cost of bike/ped elements from the larger projects.
Overall, it seems clear states are spending some of their flexible federal funds on biking and walking -- not just the small percentage specifically set aside for bike/ped by federal law -- but it’s impossible to know just how much. Fortunately, including the total costs for those "mixed" projects doesn’t appear to wildly inflate the numbers -- no $100 million road projects counted as “bike/ped” because a crosswalk or two was installed. It's also possible there are more bike/ped projects out there than are being counted, since the inadequate project descriptions may simply leave out details like pedestrian islands or sidewalks.
The big question marks that remain, even after such an exhaustive analysis, point to the need for states to improve their reporting. “Given how much money is programmed through the STIP process, more than $37 billion in federal funds alone each year, clearly the veil of secrecy caused by the complexity and lack of information produced in the STIP process must be lifted,” McLeod writes. “Without better STIP documents there is little chance that the public can meaningfully assess the performance of transportation agencies and whether planned projects reflect stated policies and performance targets.”
Stay in touch
Sign up for our free newsletter
More from Streetsblog USA
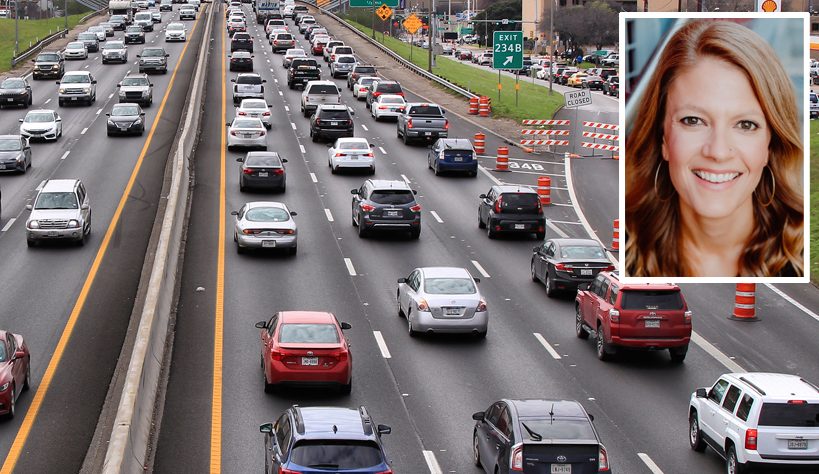
‘We Don’t Need These Highways’: Author Megan Kimble on Texas’ Ongoing Freeway Fights
...and what they have to teach other communities across America.
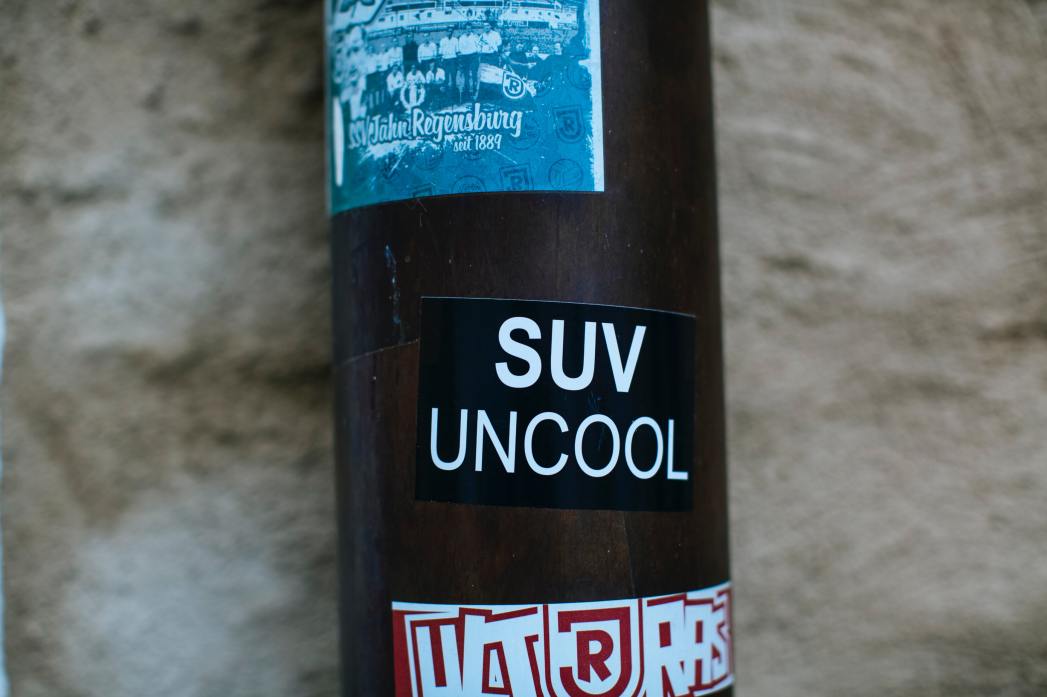
Should Wednesday’s Headlines 86 SUVs?
American tax law encourages people to buy the gas-guzzling and deadly vehicles, but some in Canada are pushing to ban them.
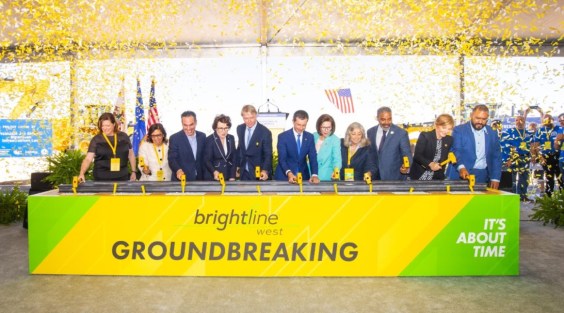
Brightline West Breaks Ground on Vegas to SoCal High-Speed Rail
Brightline West will be a 218-mile 186-mile-per-hour rail line from Vegas to Rancho Cucamonga — about 40 miles east of downtown L.A. — expected to open in 2028.
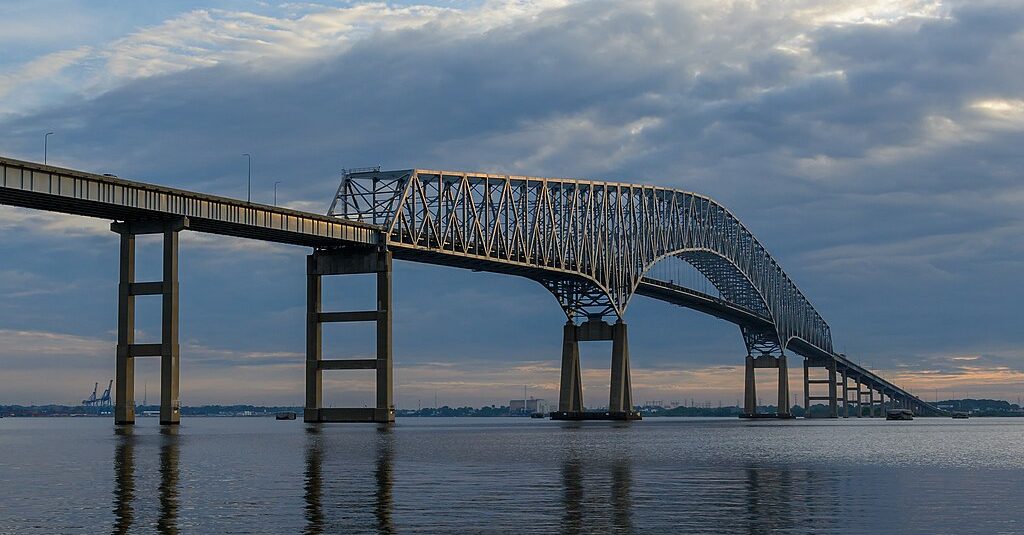
Tuesday’s Headlines Fix It First
How voters incentivize politicians to ignore infrastructure upkeep. Plus, are hydrogen trains the future of rail or a shiny distraction?
Why We Can’t End Violence on Transit With More Police
Are more cops the answer to violence against transit workers, or is it only driving societal tensions that make attacks more frequent?